Selected work · 2026
Xyora

Type
AI sales CRM
Duration
3 months
Year
2026
Role
CTO and Fullstack Developer
Outcome
Lead discovery, email verification and outreach automation shipped as one workspace in three months
Tools
- React
- TypeScript
- Vite
- Tailwind CSS
- TanStack Query
- Zustand
- Recharts
- Python
- Django
- Django REST Framework
- Celery
- Redis
- PostgreSQL
- Docker
- Cloudflare
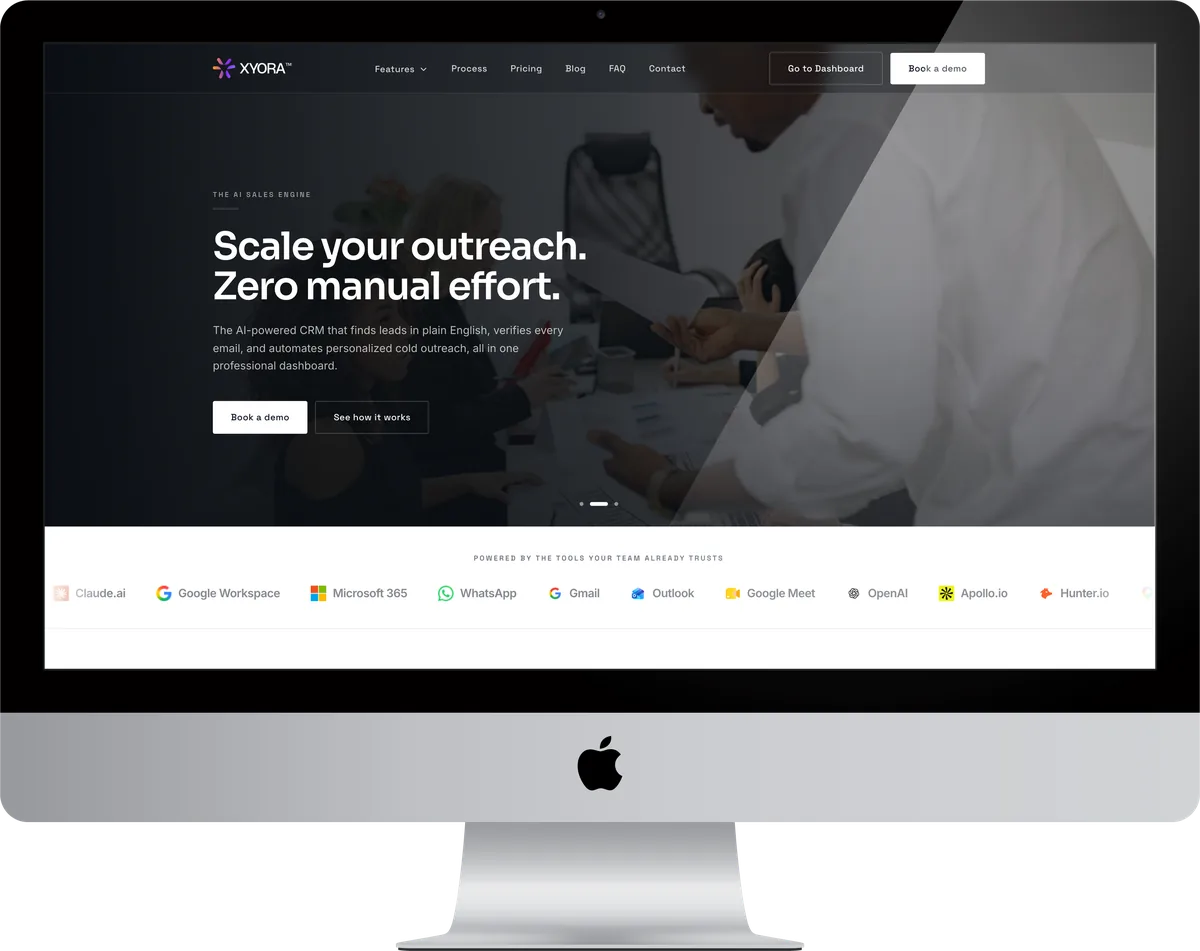
An AI sales CRM built around one idea: describe the leads you want in plain English and the system finds them. It verifies every email, then automates personalised cold outreach, with prospecting, pipeline and AI marketing living in one workspace rather than three tools. Django and PostgreSQL behind it, Redis for the queues and caching that the enrichment and sending pipelines need, React on the front.
Xyora is a CRM that starts from a sentence. You describe the leads you want in plain English, the system goes and finds them, checks that each email is real, and then runs personalised cold outreach against the ones that survive. Prospecting, pipeline and the AI marketing side all live in the same workspace, which is the point: the alternative is three tools and a spreadsheet holding them together.
Architecturally it is the most involved thing here. Django and PostgreSQL own the data, Celery runs the enrichment and sending as background work so nothing blocks a request, Redis backs both the queue and the cache, Channels carries the realtime updates, and S3 holds what gets uploaded. Three separate frontends, the marketing site, the product and the admin, all deploy to Cloudflare. It is containerised, so what runs locally is what runs in production.
Inside Xyora
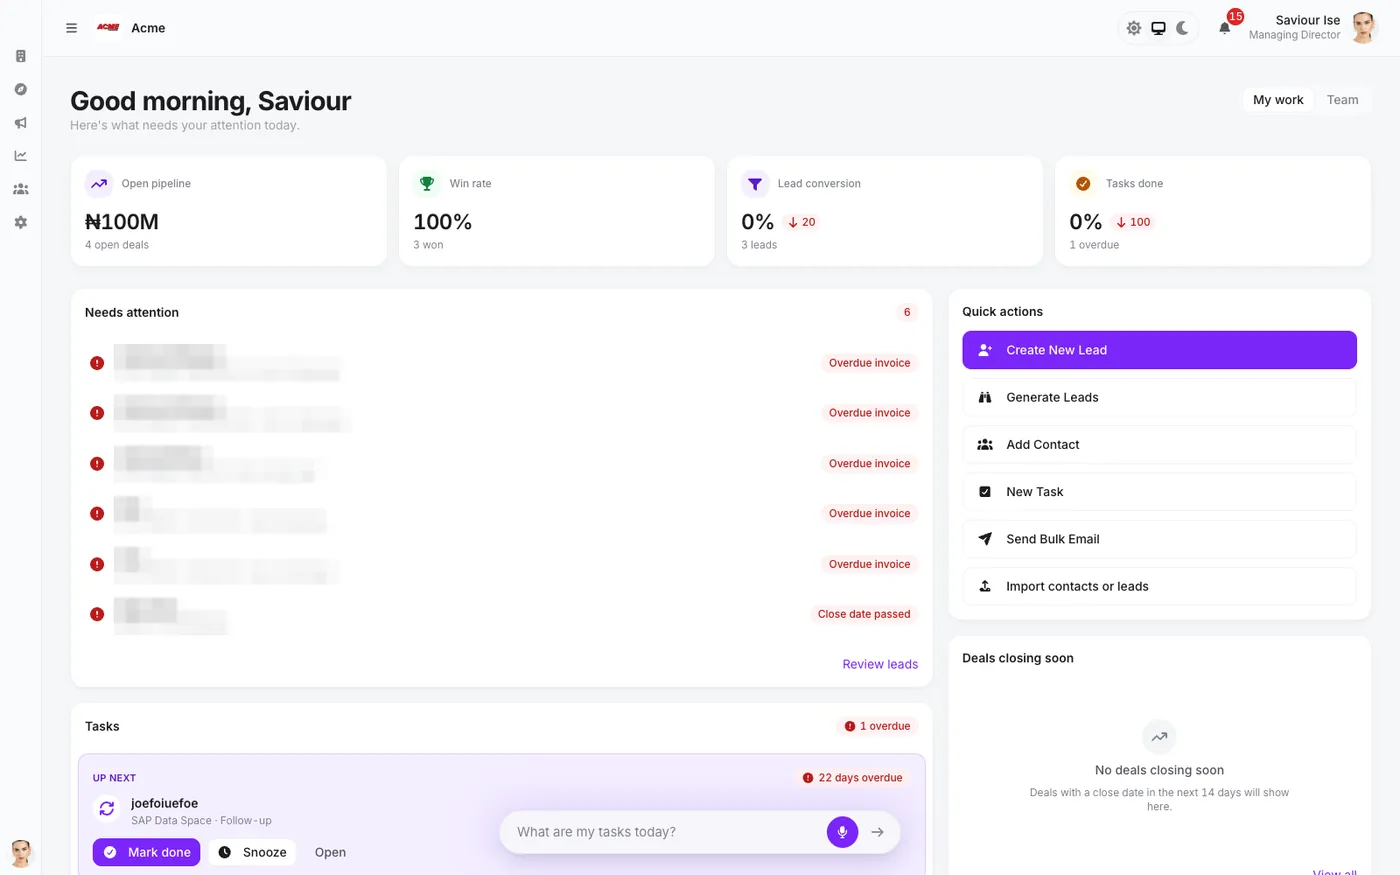
Built so the first ten seconds are useful
Xyora is a CRM that starts from a sentence: describe the leads you want in plain English and the system goes and finds them. That premise only pays off if the workspace tells you what changed while you were away, so the overview opens on exceptions rather than on charts. Four figures across the top, then a Needs attention list of overdue invoices with the deal and the delay on each, then the next task with Mark done and Snooze on it. Deals closing soon says so plainly when nothing is, instead of showing an empty chart. The right rail is the six things people actually come here to do. Every panel is a question a founder asks on a Monday, answered before it is asked.
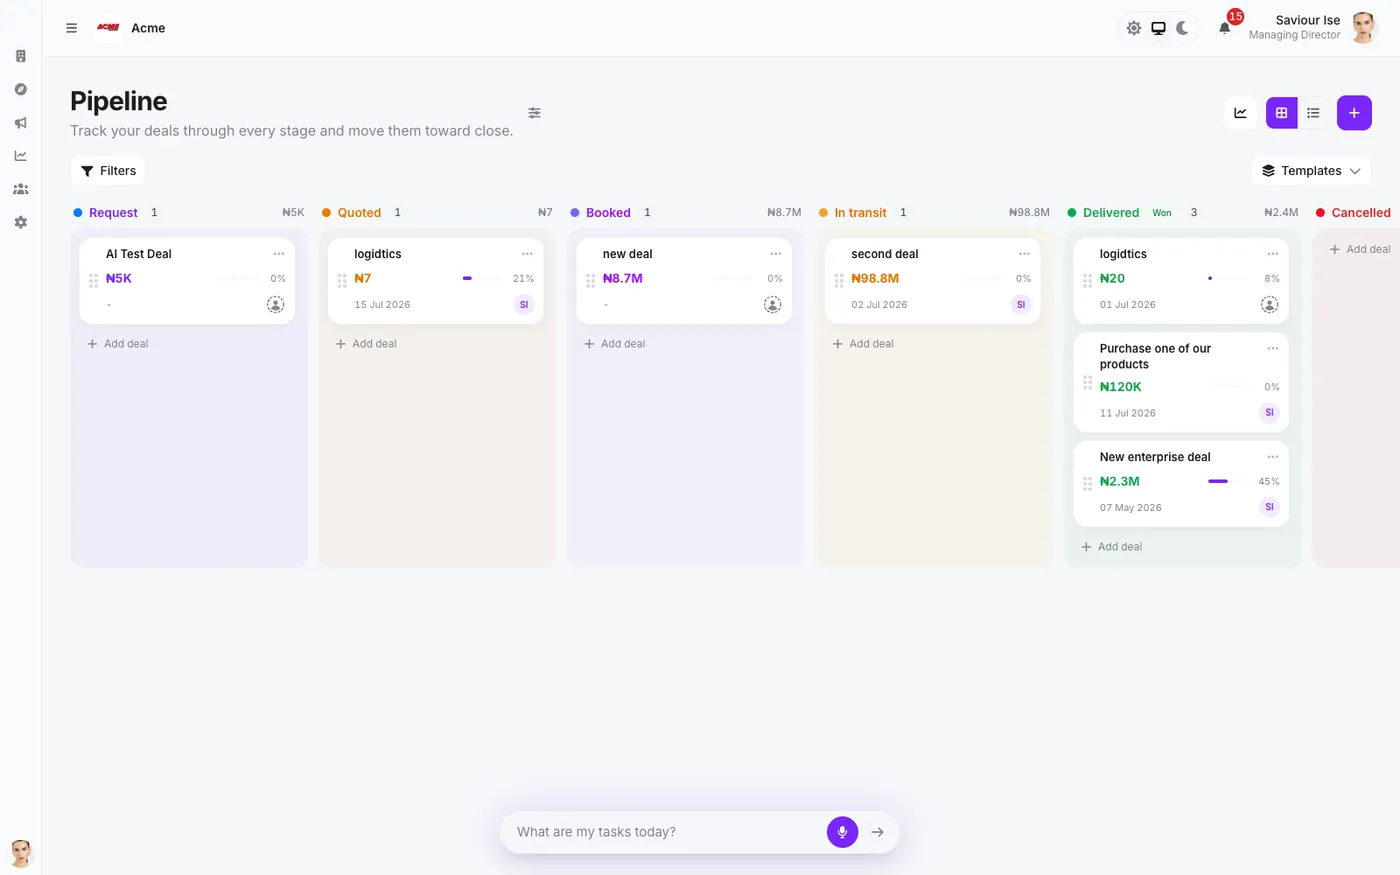
The board is the source of truth for every chart elsewhere
Six stages, each column carrying its own count and total, each card its amount, probability and close date. The reason it is a board and not a table is that a salesperson will drag a card but will not fill in a status field, and every stage change here writes a history row. That history is what the funnel on the analytics page is computed from, which is the difference between reporting that reflects reality and reporting somebody typed up at month end. PostgreSQL holds it, and the write is a single transaction so a card cannot land in two stages at once.
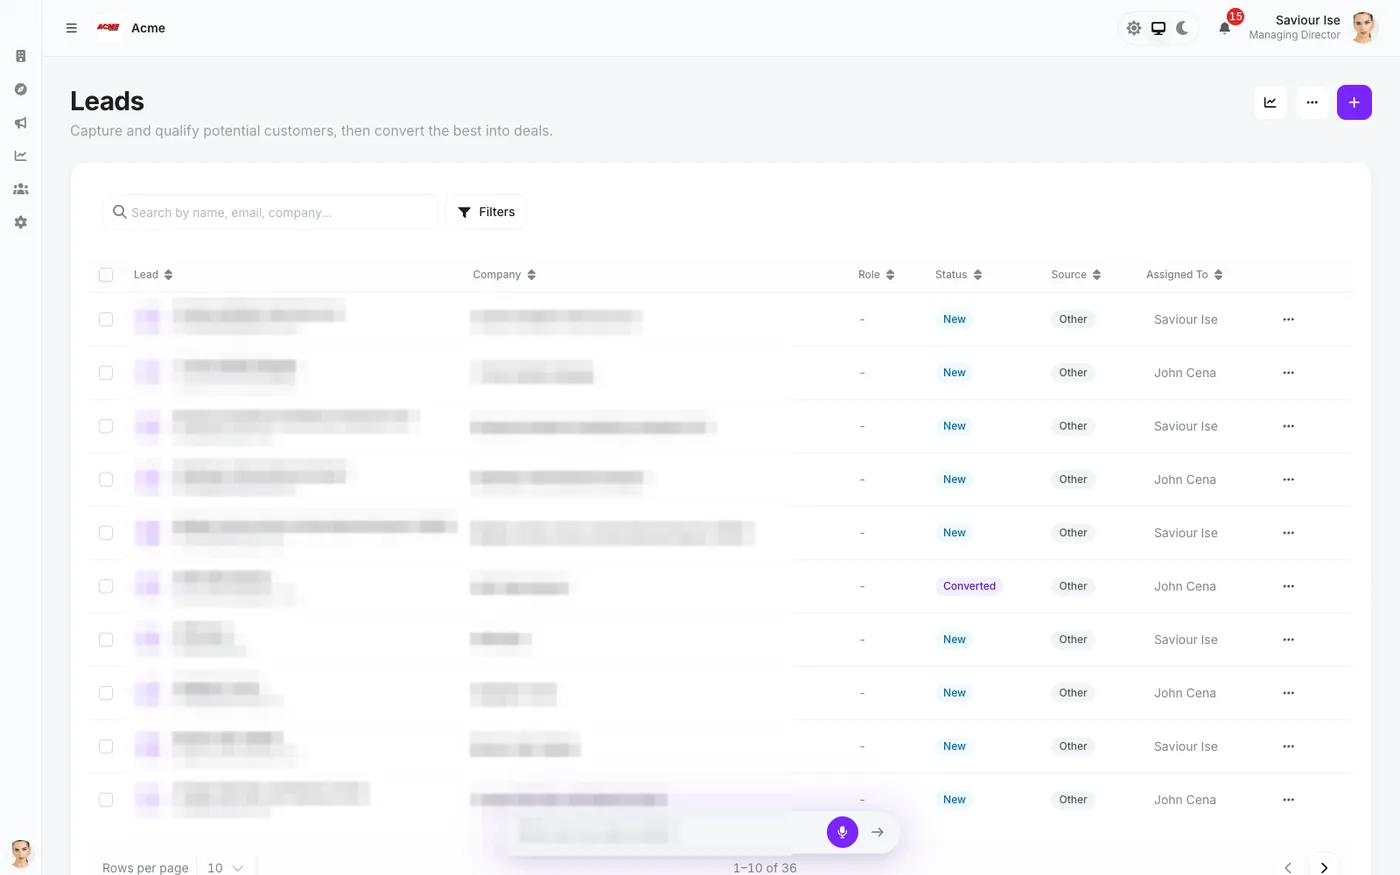
Where the AI half of the product lands
You describe an audience, the system enriches and verifies each address, and the survivors arrive here. Everything on the row exists to answer whether a lead is worth a human's time: status, source, owner. Because enrichment and verification are slow, network-bound work, they run as Celery jobs against Redis rather than in a request, and this table is simply what the workers have finished writing. That architectural choice is the reason the page is instant while the pipeline behind it may still be running.
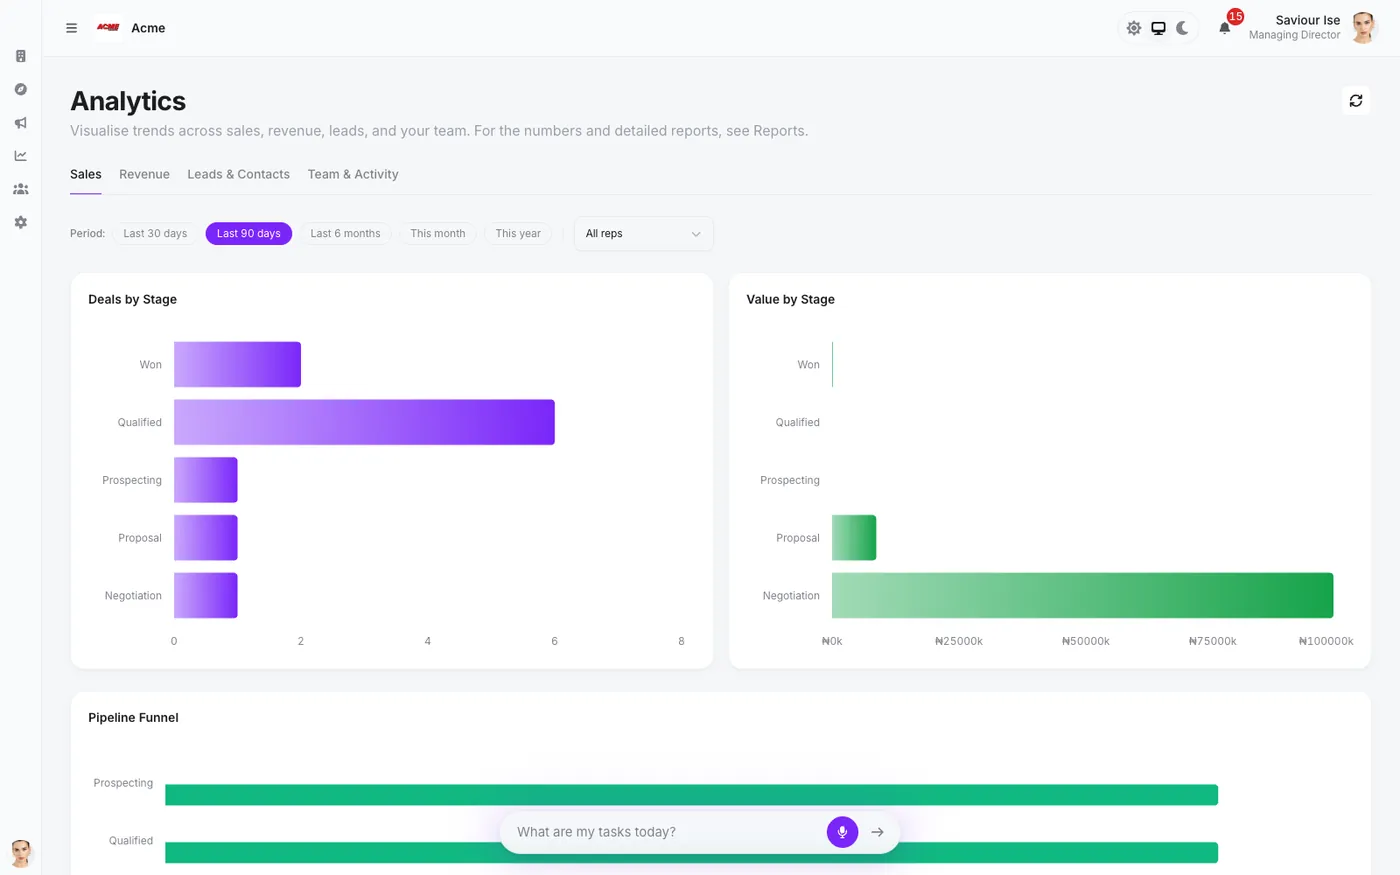
Two charts because count and value disagree
Deals by stage next to value by stage, deliberately side by side: ten small deals stuck in Quoted is a different business problem from one large one, and a single chart hides which you have. The funnel underneath shows the drop between stages. Recharts draws it from the stage history the board writes, so nothing here is self-reported. This is the view that gets screenshotted into an investor update, which is why it had to be right rather than merely pretty.
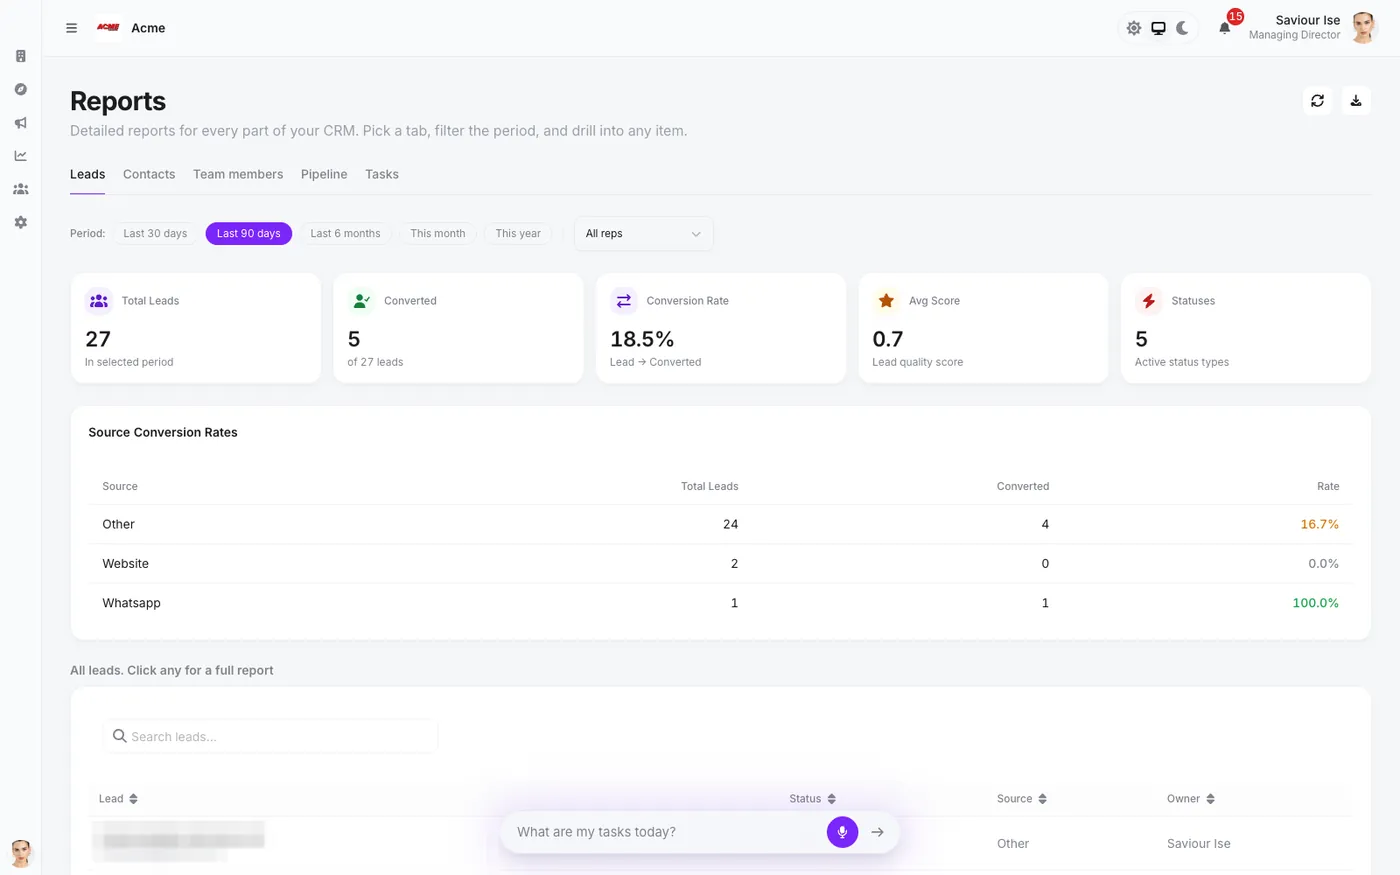
The question every founder actually has
Total leads, converted, conversion rate, average score, enrolled, and then the only breakdown that changes behaviour: conversion by source. Knowing that one channel converts at 18% and another at nothing is what tells a small team where to spend next month. Filterable by period and exportable, because it exists to be pasted into a board deck rather than admired in the app.
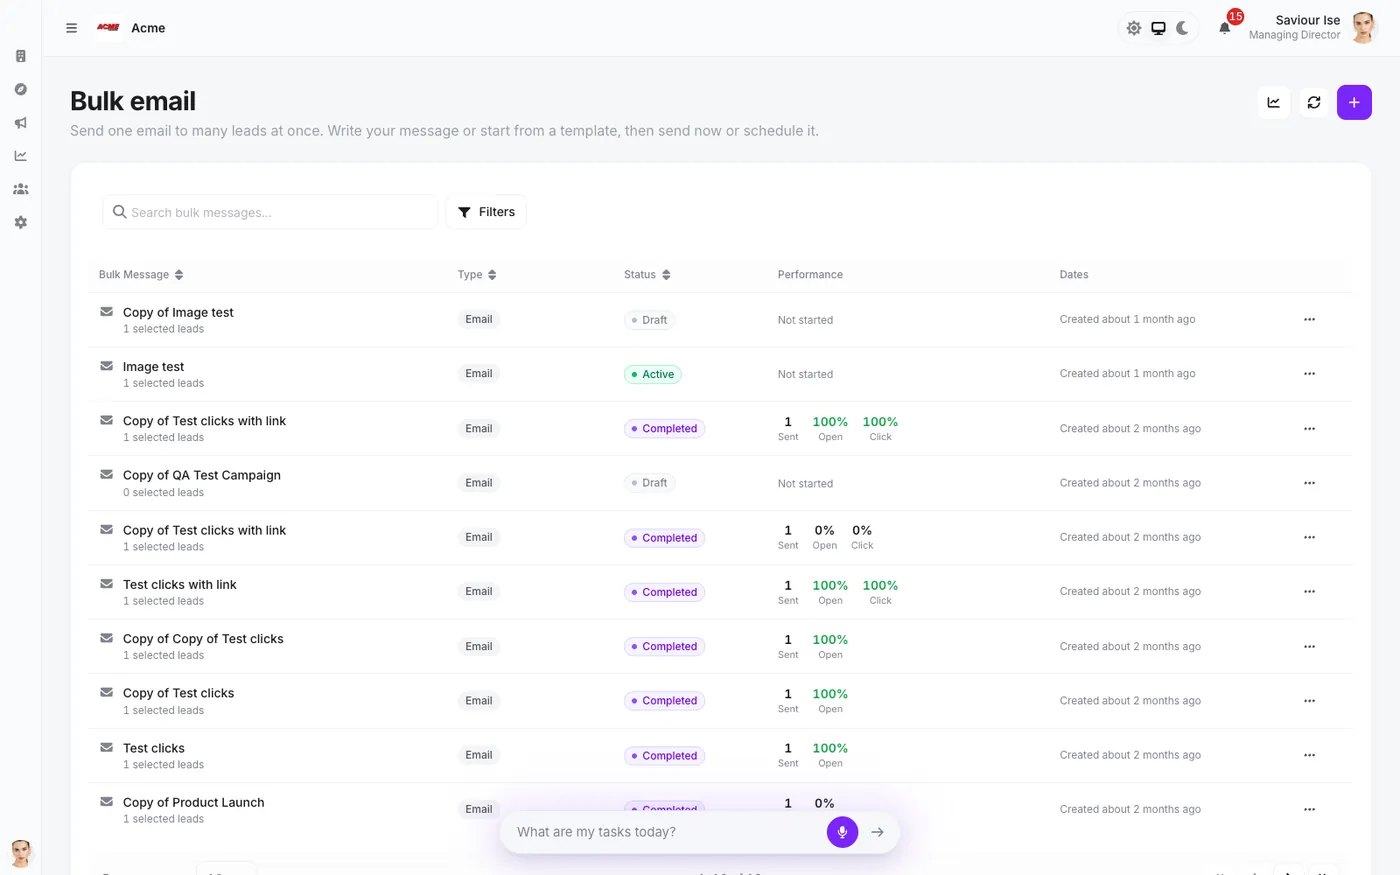
Where a background job becomes visible
Campaigns with type, status and per-send delivery and open rates. Sending is the part of this product most likely to fail quietly: an SMTP timeout, a throttled provider, a bad address. It runs on Celery workers, and this page is how a failed run surfaces as a status rather than as silence. Mixing Draft and Active into the same list means it doubles as the queue, so there is one place to look rather than two.